
Tru Fru Sales Dashboard
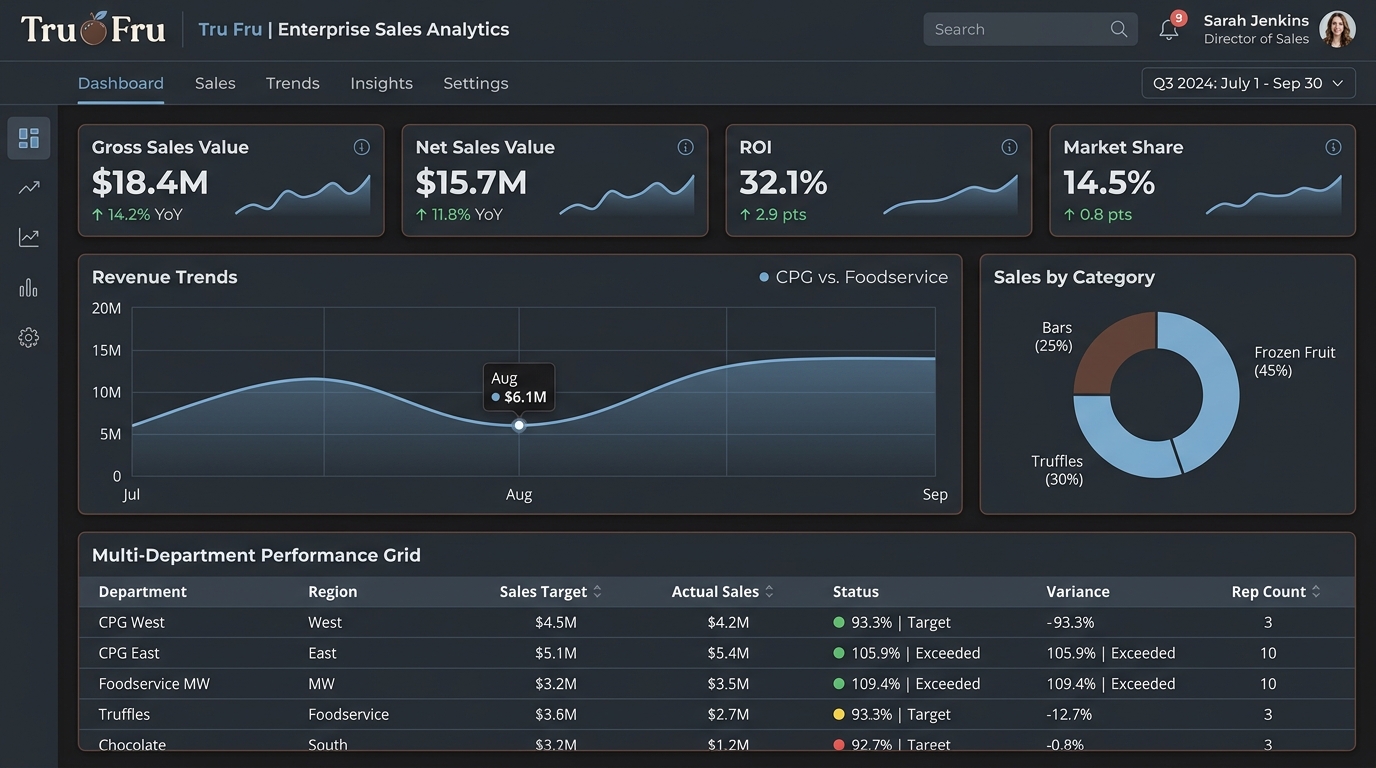
A unified enterprise analytics platform concept designed in React for Mars Inc., consolidating sales, marketing, demand planning, and experiential activation metrics.
Executive Summary
Modern CPG organizations operate through multiple interconnected business functions, each generating vast amounts of performance data.
Sales teams monitor revenue, shopper marketing evaluates retailer effectiveness, demand planning forecasts inventory, social media teams measure engagement, while experiential marketing analyzes retail activation events. Although every department contributes to the same business objectives, their data often exists in isolated reporting systems. This fragmentation makes it difficult for executives to gain a unified understanding of business performance and slows strategic decision-making.
"To address this challenge, Tru Fru initiated the design of a centralized Sales Performance Dashboard that could consolidate critical metrics from Social Media, Shopper Marketing, Demand Planning, and Experiential Marketing into a single executive reporting platform."
The objective was to eliminate reporting silos, provide a zero-click executive overview, and enable stakeholders to drill down into department-specific analytics while maintaining a consistent user experience. As the Product Designer, I was responsible for translating complex business requirements into an intuitive analytics ecosystem that supported multiple user personas, simplified enterprise reporting, and communicated insights through scalable, visually cohesive dashboards.
About Tru Fru & Mars
Tru Fru is a premium frozen fruit snack brand known for combining fresh fruit with indulgent chocolate coatings. Following its acquisition by **Mars Incorporated**, the brand became part of a broader global consumer packaged goods ecosystem, bringing increased emphasis on enterprise reporting, operational visibility, and standardized business intelligence.
As part of this engagement, the dashboard ecosystem was designed to align with Mars' reporting standards, business calendars, and executive review processes. This included supporting standardized KPI definitions, executive-level reporting for Monthly Business Reviews (MBRs) and Quarterly Business Reviews (QBRs), and providing a scalable framework capable of supporting future analytical needs across business functions. Rather than functioning as a traditional reporting dashboard, the platform was envisioned as an enterprise decision-support system capable of connecting operational data with strategic business outcomes.
Business Context
Within Tru Fru, different business teams measured success through different lenses:
Social Media Team
Focused on audience engagement, share of voice, creator performance, and campaign ROI.
Shopper Marketing
Evaluated retailer effectiveness, shelf placement strategies, promotional campaigns, and digital sales penetration.
Demand Planning
Monitored forecast accuracy, inventory health, SKU velocity, and seasonal demand variations.
Experiential Marketing
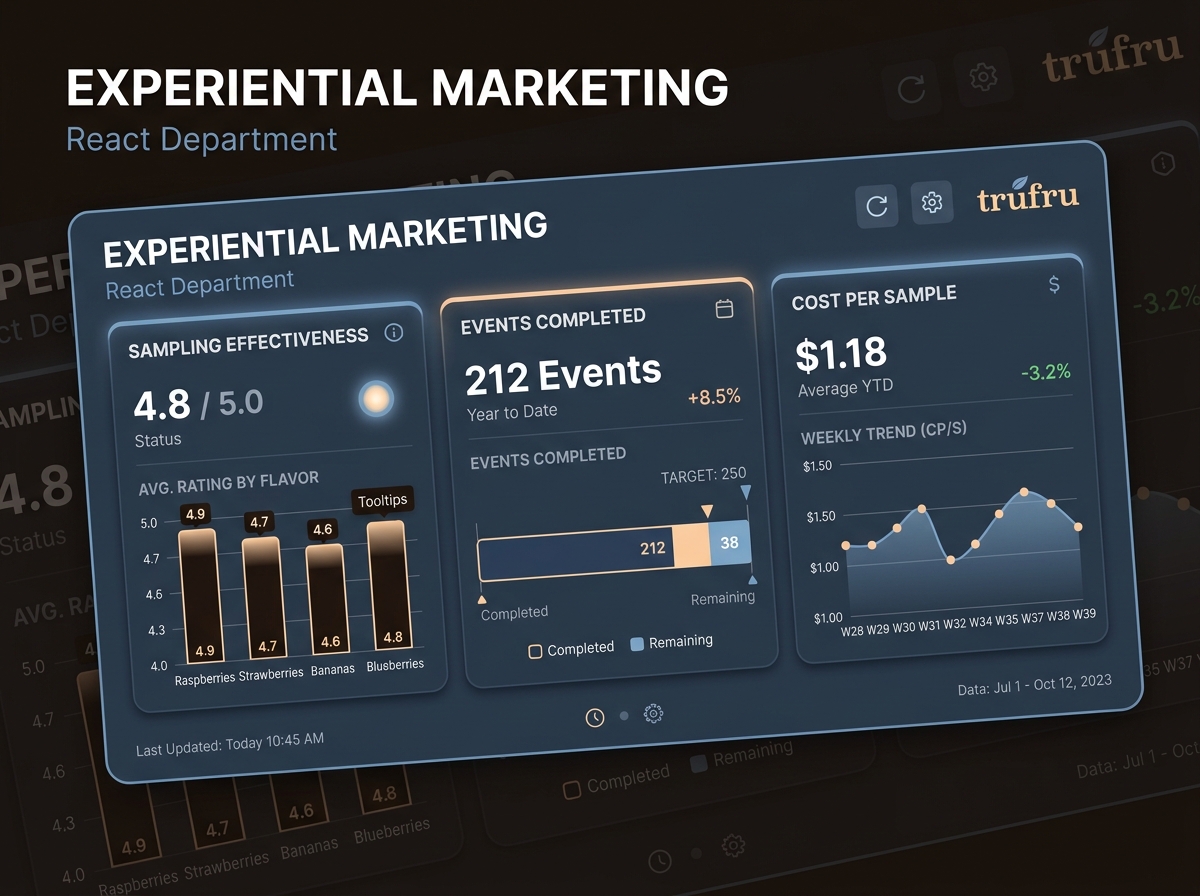
Measured offline event performance, product sampling efficiency, regional campaign impact, and retail sales lift.
While each department maintained its own metrics, leadership required a consolidated view capable of answering broader business questions, such as: which department is driving the highest ROI, which campaigns produce measurable sales lift, and how is inventory performing against demand forecasts.
Problem Statement
Enterprise reporting at Tru Fru relied on multiple disconnected dashboards owned by different business functions. Although each dashboard served its respective department, there was no centralized platform capable of presenting a complete picture of organizational performance. This created several business challenges:
Siloed Data
Data remained siloed across departments, preventing executives from understanding overall business health.
Manual Reporting Effort
Monthly and quarterly business reviews required manual consolidation of reports, consuming significant preparation time.
Delayed Reactions
Business leaders lacked a real-time view of performance, delaying reactions to changing market conditions.
Inconsistent KPI Framework
Department heads struggled to compare goals against actual performance using a consistent framework.
Analysts spent considerable effort exporting, cleaning, and reconciling data before generating insights. Competitive benchmarking was limited by fragmented systems, and granular analytics at the SKU, retailer, and campaign levels were difficult to access.
Business & Design Goals
Core Business Goals
- • **Eliminate reporting silos** across multiple CPG business departments.
- • **Provide executives with a single source of truth** for organizational performance.
- • **Enable real-time monitoring** of GSV, NSV, ROI, and Market Share.
- • **Improve strategic budget allocation** through unified business insights.
- • **Reduce manual effort** required for Monthly Business Review (MBR) and QBR reporting.
Core UX Design Principles
Zero-Click Executive Overview
Executives should immediately understand business performance without navigating multiple reports.
Department-Specific Intelligence
Each functional team has access to analytics tailored to its responsibilities while maintaining visual consistency.
Actionable Insights
Visualizations support business decisions rather than simply displaying raw numbers.
Scalable Architecture
Dashboard ecosystem accommodates future departments, KPIs, and reporting requirements without redesigns.
Success Metrics
Business Metrics
- • Reduction in reporting preparation time.
- • Faster executive decision-making.
- • Increased visibility across departments.
- • Higher adoption of standardized KPI reporting.
- • Improved alignment between marketing investments and business performance.
User Metrics
- • Reduced time to identify business anomalies.
- • Faster completion of analytical workflows.
- • Increased usage of drill-down reporting.
- • Higher satisfaction among executives, department heads, and analysts.
My Design Responsibilities
As the Product Designer, I was responsible for transforming complex business requirements into an intuitive enterprise analytics experience:
Stakeholder Collaboration
Partnering with business users to understand reporting needs.
Information Architecture
Defining the IA and structuring dashboard navigation for multiple personas.
Visual Design
Designing responsive layouts and high-fidelity React interfaces.
Handoff & QA
Creating interactive prototypes for stakeholder reviews and supporting developer handoff.
Tru Fru Sales Performance Dashboard Simulator
Select a persona and product SKU to simulate department-specific React dashboard metrics.
Select a preset view in the sidebar or adjust parameters and click update to render simulated React dashboard analytics.
Design System & Component Library
A modular component library was created to ensure consistency across dashboard experiences and support future scalability, styled using the official Tru Fru color palette:
KPI Summary Cards & Charts
Interactive Filters & Navigation
Scorecards & Comparison Tables
Status Indicators, Empty states, Loading components
Proposed React Experiential Module Spec
Stakeholder Mapping
We identified the primary stakeholder groups and understood how each consumed business information:
CXOs & Executives
Required high-level summaries focused on strategic KPIs, year-over-year growth, department comparisons, and business alerts to make rapid decisions.
Department Heads
Needed detailed performance metrics, budget utilization, campaign effectiveness, and goal-versus-actual comparisons specific to their departments.
Analysts & Operations
Required granular drill-down capabilities, advanced filtering, raw data exports, trend analysis, and forecasting support to perform deeper investigations.
User Personas Mapped
Each persona represented a unique set of objectives and pain points that directly influenced the dashboard architecture:
"Needs to compare ROI across departments and allocate marketing budgets effectively without getting lost in raw campaign data."
"Needs to improve forecast accuracy, reduce inventory waste, and monitor SKU velocity trends."
"Focuses on retailer effectiveness, digital sales penetration, and shelf placement strategies."
"Focuses on digital campaign ROI, social engagement rates, shares of voice, and competitive positioning."
"Monitors live activations, sample distribution cost efficiencies, and offline sales lifts."
Research & Discovery Phase
The discovery phase centered on business strategy, stakeholder alignment, and analytical workflows to ensure every visualization answered a real business question. The process consisted of four major activities:
Business Requirement Analysis
Defined the clear business objective: create a unified Sales Performance Dashboard that consolidates performance data from Social, Shopper, Demand, and Experiential channels.
Stakeholder Workshops
Asked fundamental questions to shift the design process from "What charts should we build?" to "What decisions should this product enable?"
KPI & Metrics Definition
Established a layered KPI framework: executive-level KPIs for organizational health, followed by department-specific metrics.
Information Architecture Planning
Ensured the final dashboard supported strategic decision-making rather than functioning as a passive reporting tool.
Design Process
The project followed an iterative enterprise design methodology focused on balancing analytical depth with executive usability:
1. Business Understanding
Analyzing CPG workflows & needs.
2. KPI Prioritization
Selecting metrics critical for decision-making.
3. IA Structure
Organizing dashboards into logical sections.
4. Wireframing
Exploring layouts to optimize scanning.
5. Hi-Fi Design
Developing polished React dashboard screens.
6. Prototype
Simulating department analytics workflows.
7. Stakeholder Review
Iterating based on internal reviews.
8. Dev Collaboration
Ensuring technical feasibility in React.
Retail Executive Journey Flow
The user flow mapped for retail operational leaders:
- 01 Login
- 02 Access Executive Overview Dashboard
- 03 Review business KPIs
- 04 Analyze Sales Performance
- 05 Monitor Inventory Health (Forecast Accuracy, SKU Velocity)
- 06 Compare Regional Performance
- 07 Investigate Operational Issues
- 08 Apply Interactive Filters
- 09 Generate Business Insights
- 10 Share reports with leadership
Key Design Decisions
Zero-Click Executive Overview
Executives should immediately understand business performance without navigating multiple reports.
Department-Specific Intelligence
Each functional team has access to analytics tailored to its responsibilities while maintaining visual consistency across the platform.
Actionable Insights
Visualizations support business decisions rather than simply displaying raw numbers.
Scalable Architecture
Dashboard ecosystem accommodates future departments, KPIs, and reporting requirements without requiring significant redesign.
Enterprise Simplicity
Despite presenting hundreds of metrics, the interface remains approachable, readable, and easy to navigate for users with varying analytical expertise.
Key Features Mapped
Executive Business Overview
A consolidated summary of retail health through high-level KPI cards covering revenue, sales growth, and inventory.
Sales Performance
Track revenue trends, category performance, regional sales, and historical comparisons.
Inventory Health Monitoring
Visualize inventory levels, stock availability, replenishment status, and stock-out risks.
Regional Analytics
Compare business performance across stores, regions, or business units through maps.
Product Category Insights
Analyze category-level performance to identify top-performing and underperforming segments.
Operational Metrics
Monitor fulfillment efficiency, operational KPIs, and business productivity indicators.
Technical Challenges Mapped
Stakeholder Appeal
Designing a dashboard capable of appealing to diverse CPG marketing and supply chain stakeholders.
Presenting Complexity
Presenting complex business metrics clearly without overwhelming users.
Data Volume Display
Displaying hundreds of metrics clearly within a unified React component architecture.
Balancing Sophistication
Balancing visual sophistication with daily operational enterprise usability.
The Final Solution
The final solution delivered a modern enterprise dashboard that transformed fragmented retail metrics into an intuitive analytical experience. By emphasizing business storytelling, KPI prioritization, and interactive exploration, the design enabled stakeholders to move efficiently from executive summaries to operational insights. The dashboard also demonstrated MathCo's ability to combine strong UX thinking with enterprise-scale analytics, strengthening the overall RFP proposal.
RFP Business Value
Strategic CPG Improvements
- • **Proactive Supply Chain:** Spot forecast variances and SKU depletion risks.
- • **MBR & QBR Prep Time Reduction:** Replaces manual spreadsheet consolidation loops.
- • **Standardized Conventions:** Aligned with Mars Inc. reporting standards.