
The Home Depot RFP Dashboard
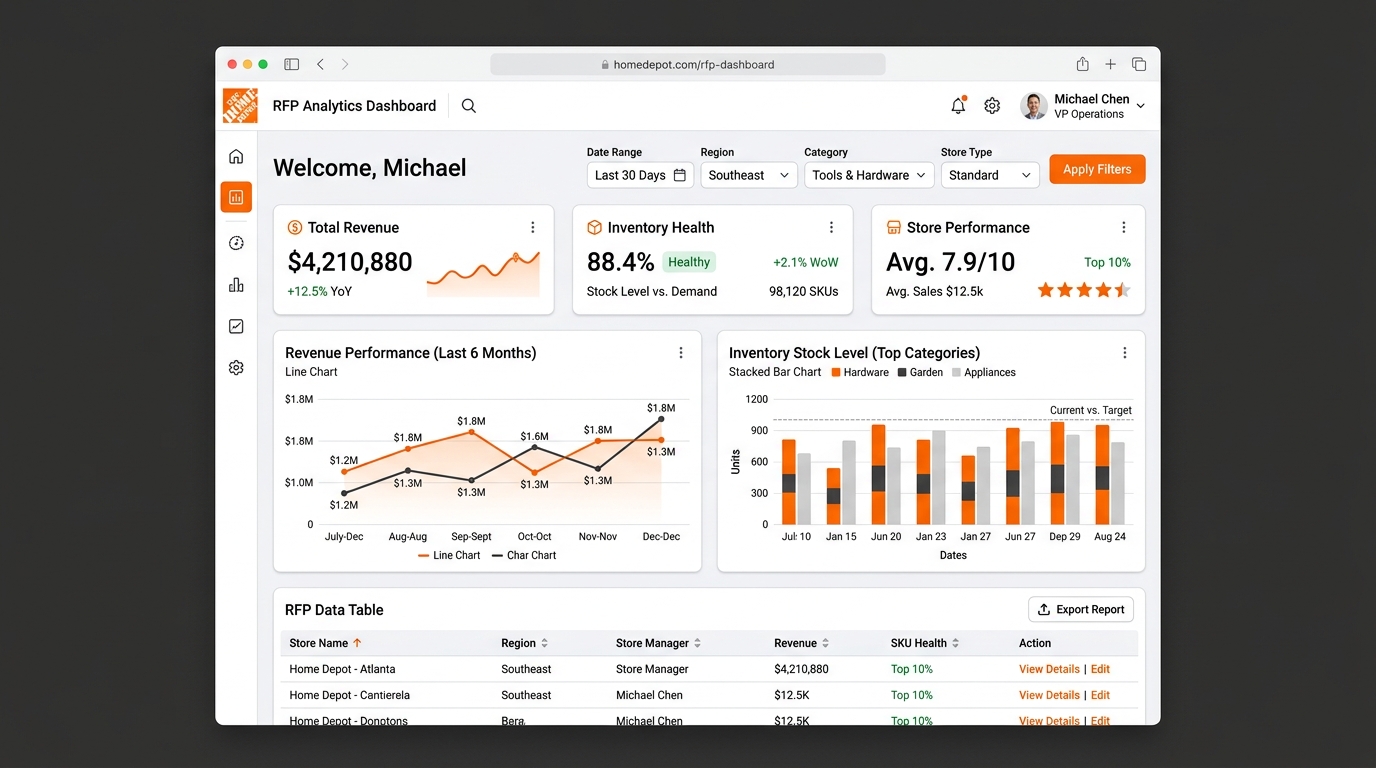
An enterprise retail business intelligence concept designed to centralize sales performance monitoring, inventory health, and store-level operations in React.
Overview & Context
The Home Depot is one of the world's largest home improvement retailers, serving millions of customers through its physical stores and digital commerce platforms.
Managing retail operations at this scale requires continuous monitoring of sales performance, inventory health, customer behavior, store operations, and supply chain efficiency. As part of a Request for Proposal (RFP), MathCo was tasked with designing a modern enterprise analytics platform that demonstrated how retail executives, category managers, and operational teams could monitor business performance through a centralized dashboard experience.
"The objective was not simply to redesign an existing reporting interface, but to envision a future-ready analytics platform capable of transforming fragmented operational data into meaningful business insights."
The dashboard needed to showcase MathCo's design capabilities while illustrating how intelligent retail analytics could support faster decision-making across the organization. As the Product Designer, I was responsible for designing an interactive dashboard concept that balanced executive-level reporting with operational analytics while maintaining a clean, scalable, and presentation-ready user experience.
Problem Statement
Large retail organizations generate massive volumes of operational data across sales, inventory, logistics, customer engagement, and store performance. However, this information is often distributed across multiple reporting systems, making it difficult for stakeholders to gain a holistic understanding of business performance. Key challenges included:
Scattered Dashboards
Business metrics were scattered across multiple disjointed dashboards.
Fragmented Overview
Executives lacked a consolidated operational overview of business health.
Slow Risk Spotting
Identifying declining sales or inventory risks required navigating multiple separate reports.
Complex Store Checks
Store-level comparisons and operational audits were time-consuming and manual.
Operational decisions relied heavily on manually generated reports, and existing dashboards prioritized data density over usability. The challenge was to design an enterprise analytics experience that simplified decision-making while effectively communicating MathCo's design and product capabilities during the RFP process.
Goals & Success Criteria
The project aimed to demonstrate how modern analytics could transform retail operations by achieving the following objectives:
Centralized Dashboard
Provide a centralized business performance dashboard consolidating metrics.
Sales & Stock KPIs
Improve visibility into sales, inventory levels, and operational KPIs.
Faster Executive Choices
Enable faster executive decision-making and risk mitigation.
Scalable Components
Create reusable dashboard components for future product line expansions.
"Success would be measured through stakeholder engagement, clarity of insights, ease of navigation, and the effectiveness of the dashboard in communicating the proposed solution."
My Design Responsibilities
As the Product Designer, I led the experience design for the dashboard concept, translating business requirements into an enterprise-grade analytical interface, responsible for:
Discovery
Understanding retail business workflows and identifying KPIs.
Info Architecture
Designing dashboard information architecture and wireframing flows.
Dashboard Design
Designing high-fidelity dashboard screens and building reusable UI components.
Handoff & QA
Creating interactive prototypes for client presentations, collaborating with devs, and supporting design reviews throughout the RFP process.
The Home Depot RFP Retail Simulator
Select a category and region to simulate real-time sales growth and stock levels.
Select a preset phase in the sidebar or adjust parameters and click update to render simulated React dashboard analytics.
Design System & Component Library
A modular component library was created to ensure consistency across dashboard experiences and support future scalability:
KPI Summary Cards & charts
Interactive Filters & navigation
Scorecards & Comparison tables
Status indicators, Geographic visualizations, Data tables, Empty/Loading states
Proposed React KPI Card Spec
Research & Discovery Phase
Although this engagement was developed as part of an RFP, the design process began with understanding common challenges faced by large-scale retail organizations. Research activities included:
Workflow Audits
- • Studying retail executive reporting workflows.
- • Understanding complex inventory and sales management processes.
- • Reviewing modern retail analytics platforms.
Pain Points Mapped
- • Benchmarking enterprise BI dashboards.
- • Identifying decision-making pain points for business stakeholders.
- • Defining the KPIs most relevant to retail leadership.
The research highlighted that decision-makers valued clarity, speed, and business storytelling over large volumes of disconnected charts.
Design Process
The project followed an iterative enterprise design methodology focused on balancing analytical depth with executive usability:
1. Business Understanding
Analyzing workflows & strategic needs.
2. KPI Prioritization
Selecting metrics critical for decision-making.
3. IA Structure
Organizing dashboards into logical sections.
4. Wireframing
Exploring layouts to optimize scanning.
5. Hi-Fi Design
Developing polished dashboard screens.
6. Prototype
Simulating business analytics workflows.
7. Stakeholder Review
Iterating based on internal reviews.
8. Dev Collaboration
Ensuring technical feasibility in React.
Retail Executive Monitoring Flow
The user flow mapped for retail operational leaders:
- 01 Login
- 02 Access Executive Overview Dashboard
- 03 Review overall Business KPIs
- 04 Analyze Sales Performance parameters
- 05 Monitor Inventory Health metrics
- 06 Compare Regional Performance ratings
- 07 Investigate Operational Issues root causes
- 08 Apply Interactive Filters (location, category, period)
- 09 Generate custom Business Insights
- 10 Share analytics reports with leadership
Key Design Decisions
Executive Dashboard First
The experience opens with a concise executive summary featuring the most critical business metrics, allowing stakeholders to understand overall retail performance within seconds.
KPI-Driven Layout
Rather than organizing information by departments, the dashboard groups related KPIs together to support faster business decision-making.
Progressive Analytics
High-level metrics seamlessly transition into detailed analytical views through drill-down interactions, enabling users to explore underlying trends without leaving the dashboard.
Retail-Oriented Visualizations
Charts, scorecards, inventory indicators, and performance heat maps were selected specifically to communicate retail business performance rather than generic BI metrics.
Consistent Navigation
Persistent navigation and contextual filters minimized unnecessary clicks while helping users maintain awareness of their analytical context.
Key Features Mapped
Executive Overview
A consolidated summary of retail health through high-level KPI cards covering revenue, sales, and inventory.
Sales Performance
Track revenue trends, category performance, regional sales, and historical comparisons.
Inventory Health
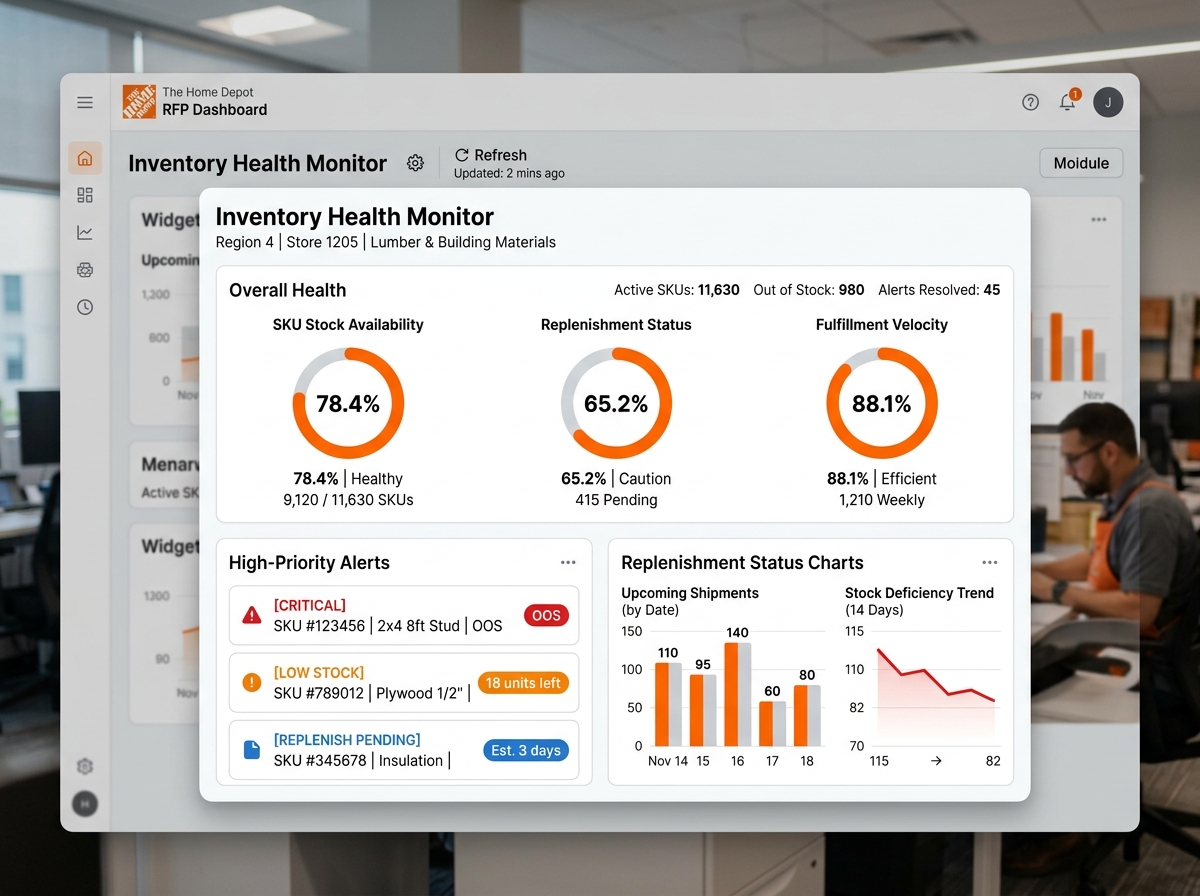
Visualize inventory levels, stock availability, replenishment status, and stock-out risks.
Regional Analytics
Compare business performance across stores, regions, or business units through maps.
Product Category Insights
Analyze category-level performance to identify top-performing and underperforming segments.
Operational Metrics
Monitor fulfillment efficiency, operational KPIs, and business productivity indicators.
Interactive Prototype Details
The interactive prototype simulated a complete executive reporting experience, serving as a key asset during the RFP presentation:
- • **Dashboard navigation** patterns.
- • **KPI exploration** & interactive filtering.
- • **Drill-down analytics** clicks.
- • **Regional comparisons** store-by-store.
- • **Inventory monitoring** alerts.
- • **Business trend analysis** & reports generation.
Design Challenges Mapped
Stakeholder Diversity
Designing a dashboard capable of appealing to diverse retail corporate stakeholders.
Presenting Complexity
Presenting complex business metrics clearly without overwhelming users.
Scope Limitations
Demonstrating advanced analytical capabilities within a limited RFP timeline.
Balancing Sophistication
Balancing visual sophistication with daily operational enterprise usability.
The Final Solution
The final solution delivered a modern enterprise dashboard that transformed fragmented retail metrics into an intuitive analytical experience. By emphasizing business storytelling, KPI prioritization, and interactive exploration, the design enabled stakeholders to move efficiently from executive summaries to operational insights. The dashboard also demonstrated MathCo's ability to combine strong UX thinking with enterprise-scale analytics, strengthening the overall RFP proposal.
RFP Business Value
Strategic Retail Improvements
- • **Proactive Inventory Management:** Real-time visibility into stock availability and stock-out alerts.
- • **Accelerated Decision-Making:** Streamlines time-to-report metrics, reducing spreadsheet dependencies.
- • **RFP Presentation Strengths:** Visual prototype strengthens proposal confidence during pitches.
Team Collaboration
This engagement involved close collaboration across multiple disciplines. I worked alongside:
RFP Deliverables Mapped
- Retail Business Analysis
- KPI Framework definition
- Dashboard Information Architecture
- User Flow Diagrams
- Low-Fidelity Wireframes
- High-Fidelity Dashboard Designs
- Interactive Prototype
- RFP Presentation Assets
Key Learnings
Strategic Value of Design in RFPs
Designing an enterprise dashboard for an RFP reinforced the importance of communicating business value through design. Unlike production products, RFP engagements must simultaneously demonstrate strategic thinking, technical feasibility, visual excellence, and future scalability within a limited timeframe. This project strengthened my ability to design executive analytics experiences, prioritize business storytelling, and create compelling product concepts that effectively communicate the potential of enterprise solutions before development begins.
Summary & Highlights
Retail Operations Envisioned
By designing a future-ready retail analytics platform for The Home Depot, we demonstrated how enterprise dashboards can consolidate complex operational data into actionable business insights. The concept emphasized executive decision-making, operational visibility, and scalable UX architecture, showcasing MathCo's capability to deliver modern, enterprise-grade retail analytics solutions while strengthening the overall RFP proposition.
Core Skills Mapped
Designer's Reflection
Although this project was created as part of a competitive proposal rather than a production implementation, it showcases an essential aspect of enterprise product design: the ability to rapidly translate business challenges into a compelling product vision. It demonstrates strategic thinking, UX maturity, and the ability to communicate complex retail operations through intuitive analytics—skills that are equally valuable in production environments and client-facing innovation initiatives.