
Otsuka Drug Launch Analytics
A centralized enterprise business intelligence platform designed in Power BI to monitor commercial performance, physician adoption, and regional sales trends.
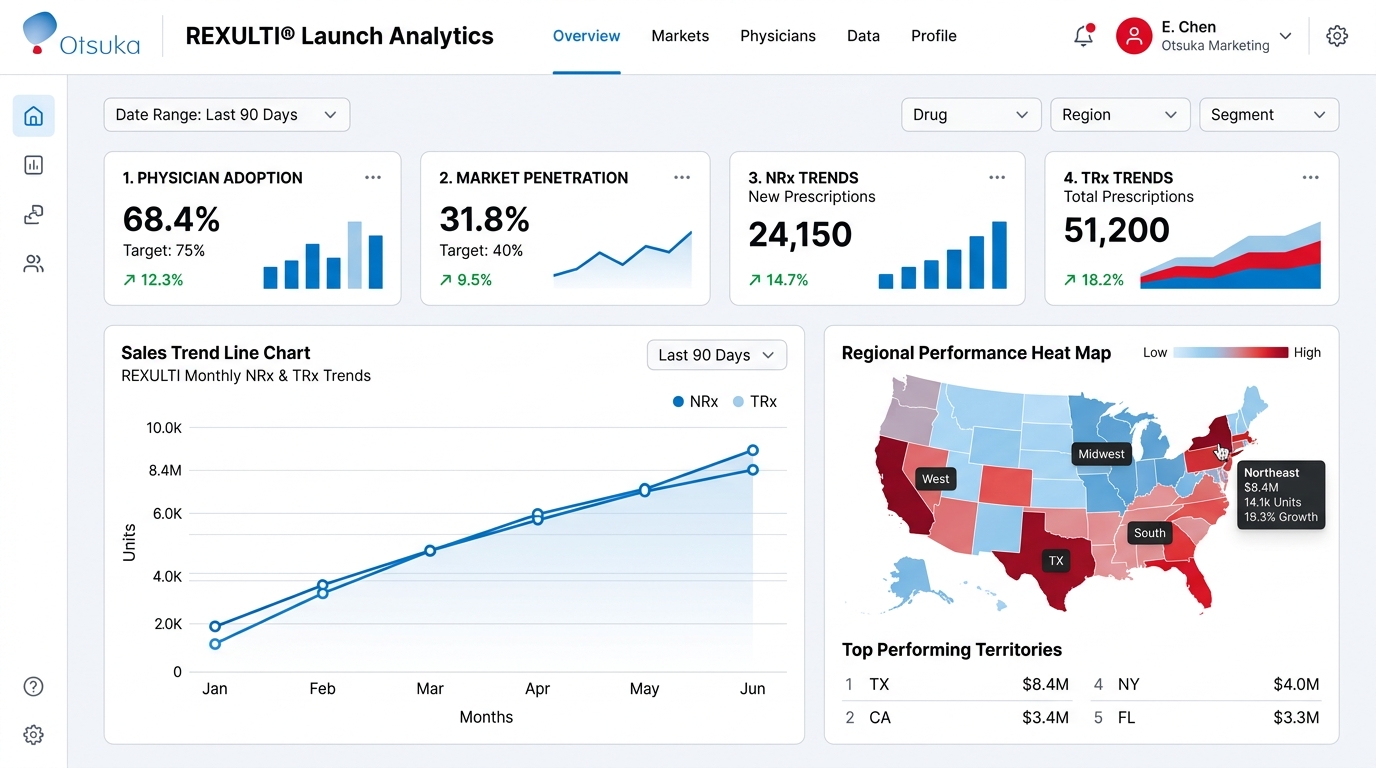
Overview & Context
Launching a new pharmaceutical product is one of the most critical and data-intensive phases in the healthcare industry. Success depends on continuously monitoring commercial performance, physician adoption, market penetration, prescription trends, regional performance, and marketing effectiveness.
However, these insights often reside across multiple disconnected systems, making it difficult for business leaders to gain a unified view of launch performance. Otsuka sought to build a centralized Drug Launch Analytics Dashboard that would enable commercial, sales, marketing, and leadership teams to monitor product performance in near real time.
"The objective was to transform fragmented datasets into actionable insights that supported faster business decisions throughout the product launch lifecycle."
As the Product Designer, I was responsible for designing an enterprise analytics experience that translated complex healthcare and commercial data into intuitive dashboards, allowing stakeholders to quickly identify trends, monitor KPIs, and make data-driven decisions.
Problem Statement
Drug launch performance was being tracked through multiple reports, spreadsheets, and disconnected BI tools, creating several operational challenges:
Lack of Unified View
Commercial teams lacked a single consolidated view of product launch health metrics.
Manual Consolidation
Regional performance comparisons required time-consuming manual spreadsheet data assembly.
Slow Report Building
Leadership teams spent significant time preparing status updates for weekly business reviews.
Reactive Interventions
Identifying underperforming markets was slow and reactive due to fragmented datasets.
Furthermore, marketing campaign effectiveness could not be easily correlated with commercial sales outcomes, making it difficult for decision-makers to prioritize sales efforts. These limitations reduced operational agility during one of the most critical phases of the product lifecycle.
Goals & Success Criteria
The primary goals of the project were to:
Centralize Metrics
Centralize drug launch performance metrics into a single enterprise Power BI analytics platform.
KPI Regional Visibility
Improve visibility into commercial KPIs across separate regions and business units.
Drill-Down Capabilities
Support strategic planning and decision-making with interactive drill-down navigation.
Scalable Design
Design a scalable dashboard system capable of supporting future Otsuka pharmaceutical launches.
"Success would be measured through improved reporting efficiency, faster access to actionable insights, greater stakeholder adoption, and more informed commercial decision-making."
My Design Responsibilities
As the Product Designer, I partnered with business stakeholders, BI engineers, and product managers to create a user-centric analytics experience, responsible for:
Discovery
Conducting stakeholder workshops and business requirements definition.
Info Architecture
Structuring dashboard information architecture and defining critical KPIs.
Dashboard Design
Designing low-fidelity wireframes and high-fidelity Power BI interfaces.
Handoff & QA
Building interactive prototypes for client validation and conducting Design QA to ensure implementation matched specs.
Otsuka Power BI Drug Launch Simulator
Select a pharmaceutical product and region to simulate real-time commercial launch metrics.
Select a preset phase in the sidebar or adjust parameters and click update to render simulated Power BI reporting graphics.
Design System & Reusable Framework
A reusable analytics design framework was created to ensure consistency across Otsuka dashboard experiences. Key reusable components included:
KPI cards & Scorecards
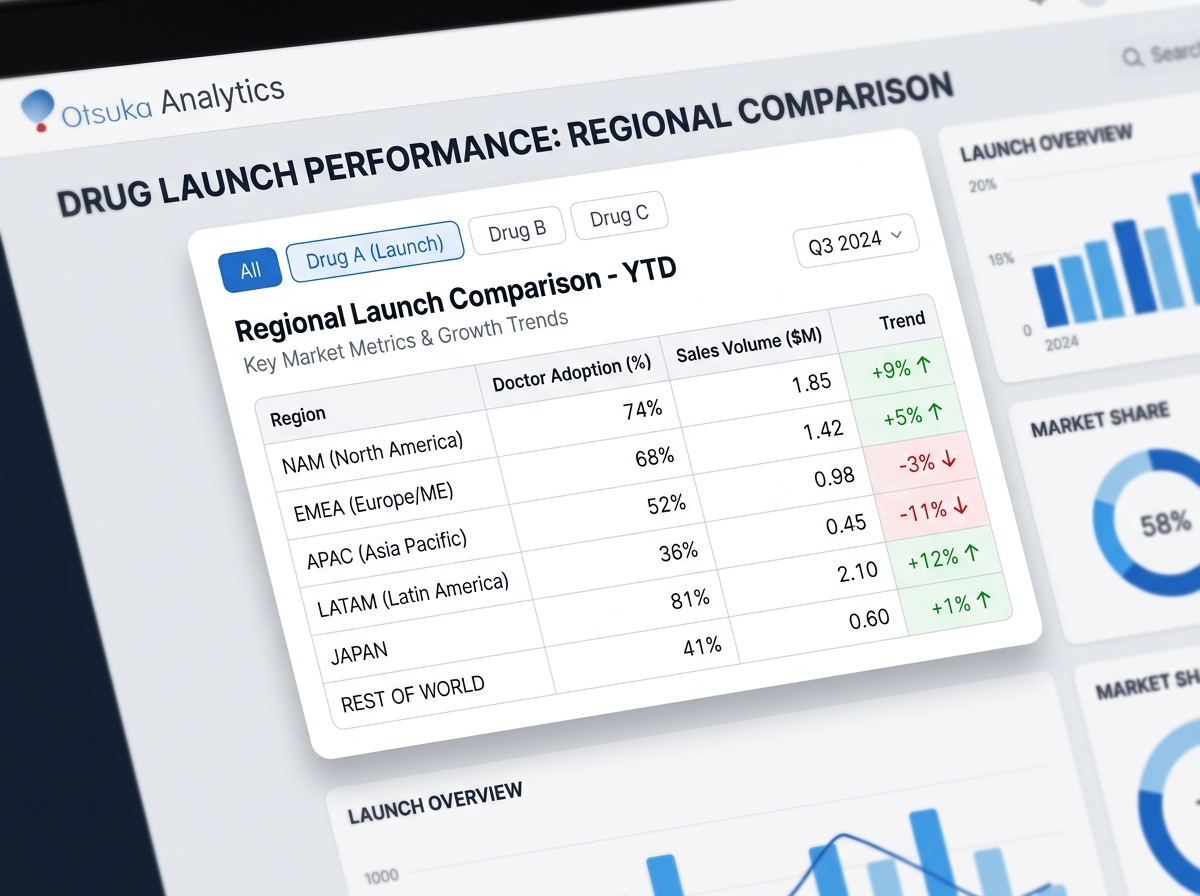
Analytical Charts & maps
Interactive Filters
Data tables, Drill-down navigation, Trend indicators, Empty/Loading states
Otsuka Power BI Table Specification
Research & Discovery Phase
The discovery phase focused on understanding how different business functions consumed launch performance data. Activities included:
Interviews & Alignment
- • Stakeholder interviews with commercial and marketing teams.
- • Workshops with business analysts to identify reporting pain points.
- • Benchmarking enterprise analytics dashboards for healthcare.
KPI Audits
- • Analysis of existing launch reports and spreadsheets.
- • Prioritization of high-value, launch-critical KPIs.
- • Mapping user journeys across different organizational roles.
Research revealed that users preferred dashboards capable of answering business questions immediately rather than presenting large volumes of raw data.
Design Process
The project followed an iterative enterprise dashboard design methodology across 8 core phases:
1. Business Discovery
Understanding workflows & goals.
2. KPI Definition
Prioritizing launch success metrics.
3. IA Structure
Organizing into analytical sections.
4. Wireframing
Optimizing layout for visual scanning.
5. Hi-Fi UI
Polishing Power BI interface specs.
6. Prototype
Validating dashboard navigation.
7. Handoff
Preparing developer specifications.
8. Design QA
Ensuring final Power BI build match.
Commercial Performance Monitoring Journey
The user journey mapped for Otsuka commercial analytics leaders:
- 01 Login
- 02 Access Launch Overview Dashboard
- 03 Review high-level Executive KPIs
- 04 Analyze Sales Performance trends
- 05 Compare Regional Metrics mapping
- 06 Identify emerging Market Trends
- 07 Investigate Performance Drivers root causes
- 08 Apply Interactive Filters (product, geography, period)
- 09 Export structured Business Reports
- 10 Present insights reports to leadership
Key Design Decisions
Executive Summary First
The dashboard opened with high-level KPI cards, allowing leadership teams to understand overall launch performance within seconds before exploring details.
Layered Analytics
Information was progressively disclosed through drill-down interactions, enabling users to move from summaries to detailed regional insights.
Visual Storytelling
Related metrics were grouped into analytical sections that told a cohesive business story, helping users understand not just what changed but why.
Interactive Filtering
Global filters enabled users to quickly compare launch performance across products, regions, and reporting periods without navigating multiple sub-pages.
Consistent KPI Hierarchy
Critical business metrics were prioritized using strict visual hierarchy, ensuring the most important insights remained immediately visible during reviews.
Key Features Mapped
Executive KPI Dashboard
A centralized overview displaying launch health through high-level performance indicators.
Sales Performance Analytics
Visualizations tracking prescription growth, sales trends, and commercial performance over time.
Geographic Performance
Interactive regional maps and comparative views highlighting high-performing markets.
Marketing Effectiveness
Dashboards correlating campaign activities with commercial outcomes to support optimization.
Trend Analysis
Historical performance tracking enabled users to identify growth patterns and emerging risks.
Interactive Drill-Down
Users could navigate from summary metrics into detailed reports without leaving the page.
Interactive Prototype Details
Interactive prototypes demonstrated complete analytical workflows, enabling stakeholders to validate reporting structures before Power BI implementation, reducing redesign effort:
- • **Executive dashboard navigation** parameters.
- • **KPI exploration** & filter interactions.
- • **Drill-down analytics** click-throughs.
- • **Regional comparisons** and maps.
- • **Trend analysis** visualizations.
- • **Report generation** & export flows.
Design Challenges Mapped
Data Complexity
Simplifying highly complex healthcare and pharmaceutical commercial data matrices.
Balancing Detail
Balancing high-level executive summaries with necessary detailed analytical exploration.
Data Density
Displaying large, multi-system datasets on one screen without overwhelming business users.
Power BI Constraints
Designing custom layout grids optimized specifically for Power BI capabilities.
The Final Solution
The final solution transformed fragmented reporting processes into a unified analytics platform that enabled business users to monitor launch performance through intuitive visualizations, interactive exploration, and actionable insights. The dashboard combined executive summaries with detailed analytical capabilities, empowering stakeholders to move from observation to decision-making within a single interface.
Business Impact
Strategic Commercial Benefits
- • **Performance Visibility:** Significantly improved visibility into regional commercial launch KPIs.
- • **Market Trend Detection:** Accelerated detection of underperforming market sectors.
- • **Scalable Foundations:** Established a repeatable framework for future drug launches.
Team Collaboration
This project required close collaboration across business and technical teams. I worked alongside:
Final Deliverables Package
- Business Requirement Analysis
- KPI Framework documentation
- Dashboard Information Architecture
- User Journey Maps & Wireframes
- High-Fidelity Dashboard Designs
- Clickable Interactive Prototype
- Power BI Design Specifications
- Developer Handoff specifications
Key Learnings
Analytical Storytelling
Designing enterprise analytics for pharmaceutical product launches reinforced the importance of translating large, complex datasets into clear business narratives. Effective dashboard design is not about displaying more data — it is about presenting the right information, in the right context, at the right time. This project strengthened my ability to design executive-level BI experiences, prioritize analytical storytelling, and create scalable dashboard systems that support strategic business decisions.
Summary & Highlights
Launch Reporting Experience Transformed
By redesigning Otsuka's drug launch reporting experience into a centralized analytics platform, we enabled commercial and leadership teams to monitor launch performance through intuitive dashboards, interactive exploration, and actionable insights. The solution simplified complex healthcare analytics, improved reporting efficiency, accelerated decision-making, and established a scalable business intelligence framework for future product launches.