
Goodyear Copilot Analytics Dashboard
An AI Adoption Intelligence Platform for Microsoft Copilot designed to monitor rollout, optimize licensing investments, and quantify Generative AI business value.
1. Overview
A. Project Background
As organizations increasingly adopt Generative AI tools, measuring their real business impact has become equally important as deploying them. Goodyear rolled out Microsoft Copilot licenses to selected employees across departments to understand how AI could improve productivity, automate repetitive work, and enhance employee efficiency. However, leadership lacked a centralized platform to answer critical questions such as:
- Are employees actually using Copilot?
- Which departments have the highest adoption?
- How much productivity is being gained?
- Is the investment generating positive ROI?
- Are employees satisfied with the tool?
- How many additional licenses should be purchased?
- Are there governance or compliance risks?
Most of this information was scattered across Microsoft 365 Admin Center reports, usage logs, spreadsheets, and individual department feedback, making it difficult for executives to evaluate the success of the rollout. To solve this, Goodyear initiated the **Copilot Analytics Dashboard**, a centralized analytics platform that combines adoption metrics, licensing insights, productivity KPIs, ROI measurements, governance indicators, and employee sentiment into a single executive dashboard. The platform enables business leaders to make informed decisions regarding AI adoption, licensing strategy, and future investments in Generative AI.
B. Solution Overview
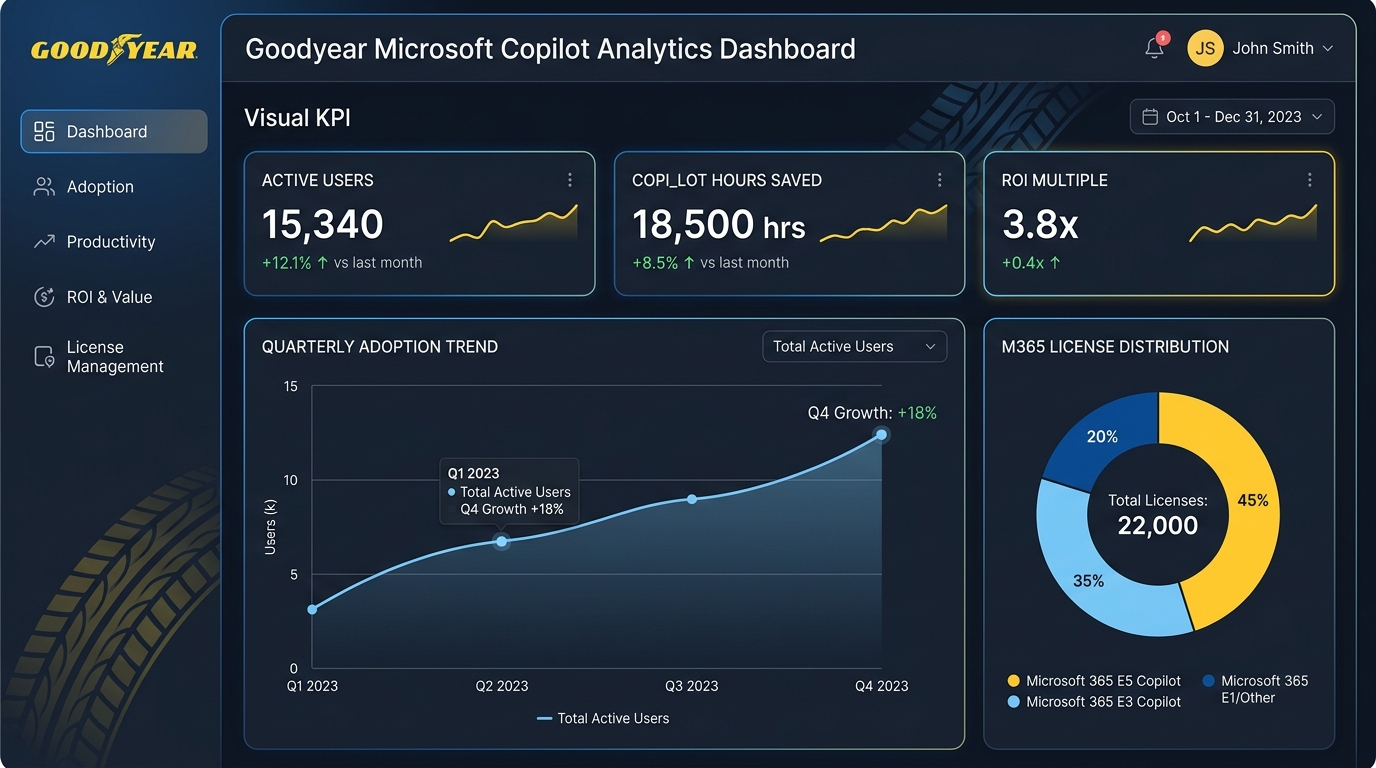
The Goodyear Copilot Analytics Dashboard is a desktop-first analytics platform designed to provide leadership with a comprehensive view of Microsoft Copilot usage across the organization. The solution consolidates operational, financial, and behavioral metrics into one unified interface, allowing executives to evaluate AI adoption from multiple dimensions.
C. Indepth Analysis of all the Screens & Info
Executive Overview Screen
Provides an organization-wide snapshot of Copilot adoption and business performance through high-level KPIs including: Total Licenses, Active Users, Daily Interactions, Efficiency Index, Hours Saved, ROI Multiple, and Sentiment Score. Serves as the executive landing page for quick health assessment.
Readiness & Licensing Screen
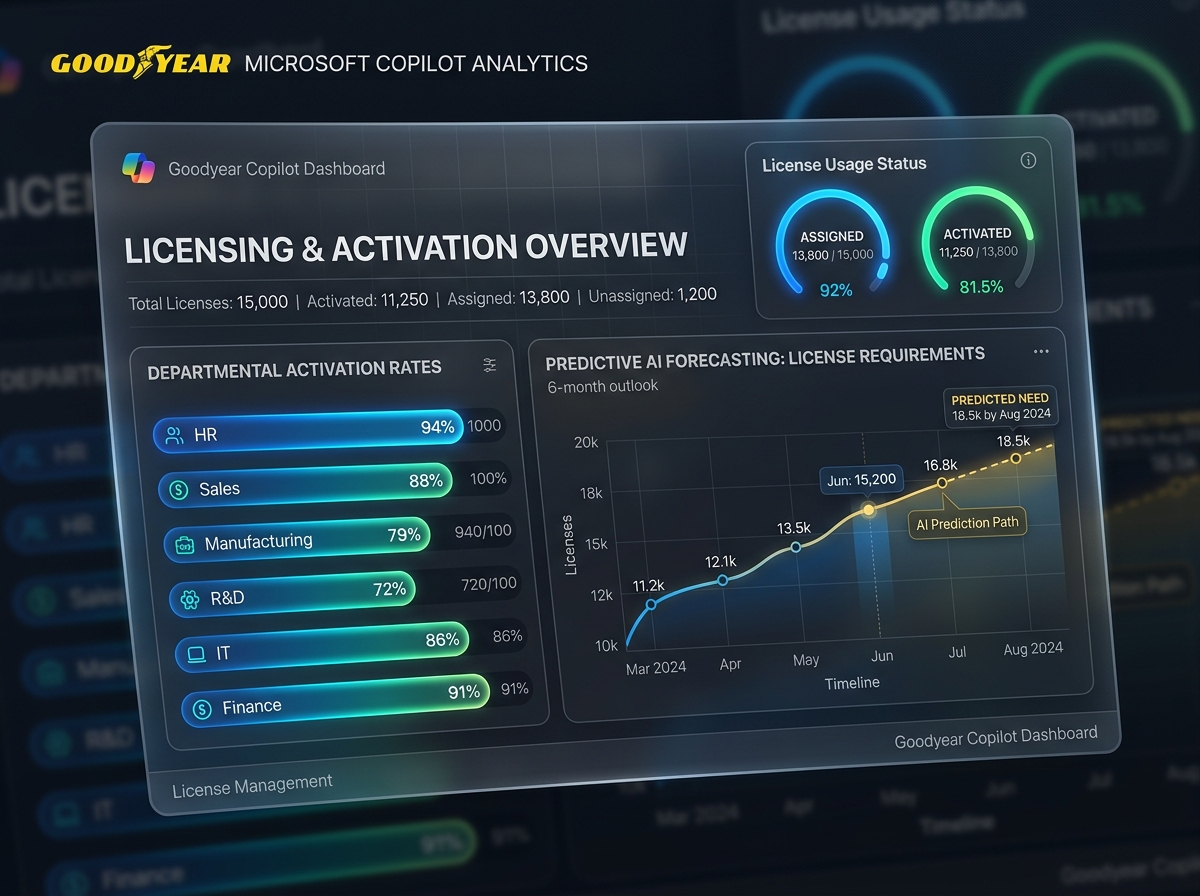
Helps IT and leadership understand organizational readiness by tracking: Eligible Employees, Assigned Licenses, Activated Licenses, Pending Activations, Regional Readiness, and Department-wise Activation Rates. Enables smarter license planning and budget allocation.
Adoption & Usage Screen
Measures how Copilot is being used throughout the organization. Insights include: Daily Active Users, Weekly Active Users, Monthly Active Users, Peak Usage Hours, Most Active Departments, Application Usage Distribution, Prompt Categories, and Usage Trends. Identifies adoption success and enablement needs.
Impact & ROI Screen
Measures the business value generated through Microsoft Copilot. Key insights include: Time Saved per Employee, Email Response Improvements, Document Creation Speed, Meeting Time Reduction, Annual Cost Savings, Productivity Index, and ROI Trends. Connects usage directly to measurable business outcomes.
Sentiment & Learning Screen
Measures employee adoption from a human perspective, including: Employee Satisfaction, Learning Completion, Certifications, Training Hours, Feedback Trends, Learning Module Progress, and Most Common Feedback Keywords. Helps identify upskilling needs and employee engagement.
Governance & Predictive Insights
Ensures responsible AI adoption through governance monitoring: Policy Compliance, Security Incidents, Flagged Prompts, Privacy Scores, Risk Teams, Future Adoption Forecasts, Compliance Events, and Business Unit Risk Monitoring. Allows proactive compliance intervention.
2. Overall Impact & Outcomes
The dashboard transformed fragmented reporting into a centralized executive decision platform. Key outcomes include:
Unified Visibility
Unified AI adoption visibility across the organization, eliminating isolated tracking spreadsheets.
Faster Decision-Making
Faster executive decision-making enabled by real-time high-level KPI cards and progress meters.
Licensing Optimization
Improved licensing optimization by highlighting inactive users and pending activations.
ROI Measurement
Clear, direct measurement of business ROI by converting productivity hours saved into financial metrics.
Compliance & Governance
Better governance and compliance monitoring to detect security incidents and policy violations proactively.
Data-Driven Budgeting
Data-driven budgeting for future AI investments based on real usage patterns rather than assumptions.
3. Goals Achieved
North Star Goal Achieved
Create a centralized executive analytics platform that enables Goodyear leadership to measure, monitor, and optimize Microsoft Copilot adoption while quantifying business value and supporting strategic investment decisions in Enterprise AI.
"Rather than only measuring software usage, the dashboard focuses on answering one critical business question: 'Is Microsoft's Copilot creating measurable business value for Goodyear?'"
4. Success Metrics & KPIs
| Metric | Planned Target | Notes / Business Context |
|---|---|---|
| License Activation Rate | Increase activation across departments | Monitor adoption readiness closely. |
| Daily Active Users | Increase monthly active usage | Measure active platform engagement. |
| Productivity Improvement | Reduce repetitive tasks and work | Quantified through time saved in workflows. |
| Hours Saved per User | Increase weekly productivity gains | Primary executive benchmark KPI. |
| ROI Multiple | Demonstrate positive business value | Justifies future enterprise AI software investment. |
| Employee Satisfaction | Improve Copilot satisfaction sentiment | Evaluates training and enablement effectiveness. |
| Governance Compliance | Maintain >95% policy compliance | Ensures responsible and secure AI adoption. |
| Training Completion | Increase certification rates | Tracks upskilling progress metrics. |
5. Business Impact Summary
- **ROI Quantification:** Enabled leadership to quantify financial ROI from Microsoft Copilot investments.
- **Cross-Unit Visibility:** Improved visibility into AI adoption rates across separate business units and regions.
- **Consolidated Reporting:** Reduced dependency on multiple fragmented admin reporting tools.
- **Smart Procurement:** Supported future license procurement decisions through real historical usage data.
- **Targeted Training:** Helped identify departments requiring additional training or upskilling support.
- **Adoption Transparency:** Increased transparency into productivity improvement metrics.
- **Proactive Governance:** Strengthened compliance monitoring and predictive risk analytics.
6. Problem Statement
Goodyear invested significantly in Microsoft Copilot licenses but lacked a centralized way to evaluate whether employees were using the platform effectively or whether the investment was delivering measurable value.
Usage metrics, licensing information, employee feedback, productivity gains, and governance data existed across multiple systems without a unified reporting experience. As a result, executives struggled to answer strategic questions regarding adoption, ROI, and future investment planning.
7. Objectives & Business Impact
A. Measure Enterprise AI Adoption
Monitor adoption across departments and regions. Identify high-performing and low-performing business units to allocate licenses appropriately.
B. Quantify Productivity Gains
Track hours saved, measure improvements in email response time, evaluate meeting efficiency, and monitor document creation speedups.
C. Optimize Licensing Investments
Track eligible employees, monitor activation rates, identify unused licenses, and support future procurement decisions with real data.
D. Ensure Responsible AI Usage
Monitor compliance, detect policy violations, track flagged prompts, and assess governance risks to prevent data leakage.
E. Improve Employee Enablement
Monitor learning progress, measure certifications, analyze employee satisfaction sentiment, and identify training opportunities.
8. Strategic Value
A. Root Causes Identified
Before designing the dashboard, we identified five critical systemic root causes of inefficiency:
Invisible Adoption
AI adoption lacked central reporting visibility across departmental rollouts.
Unquantified ROI
Business ROI was difficult to measure and prove to executive leadership.
Assumption-Based
Licensing decisions were based on assumptions rather than active usage.
Disconnected Feedback
Employee sentiment remained disconnected from actual software usage metrics.
Scattered Tools
Governance compliance monitoring required maintaining multiple security systems.
B. Guided Decisions
These findings led to designing an integrated analytics platform that combines Executive KPIs, Adoption Analytics, Licensing Intelligence, Productivity Metrics, Employee Learning, and Governance Monitoring within a single, cohesive experience.
9. Scope & Outcomes
A. Project Scope
The scope focused on designing an enterprise analytics dashboard capable of monitoring Microsoft's Copilot rollout across the entire organization, delivering:
Executive Dashboard
Licensing Analytics
Adoption Monitoring
ROI Tracking
Learning Analytics
Governance Dashboard
B. Key Outcomes
- • **Centralized Reporting:** Consolidated multiple separate reports into one single source of truth.
- • **Executive-Ready Insights:** High-level dashboard layouts for fast status updates.
- • **Data-Driven Budgeting:** Enabled smart, usage-backed software license purchasing.
- • **Faster AI Investment Decisions:** Justified rollout ROI through productivity benchmarks.
- • **Improved Transparency:** Mapped active usage rates transparently across departments.
10. Product Goals
- Increase Copilot adoption.
- Improve employee productivity.
- Quantify AI-generated ROI.
- Optimize software licensing.
- Improve employee enablement.
- Strengthen AI governance.
- Support enterprise AI strategy.
11. Target Audience & Stakeholders
A. Persona Details about Audience & Stakeholders
12. Challenges & Opportunities
Constraints
- • Data spread across multiple Microsoft services.
- • High-volume enterprise usage metrics.
- • Multiple stakeholder requirements.
- • Complex KPI hierarchy.
- • Need for executive-friendly visualizations.
Opportunities
- • Create a single source of truth.
- • Simplify executive reporting.
- • Improve AI investment decisions.
- • Enable predictive analytics.
- • Support long-term AI transformation initiatives.
13. User Pain Points
| Pain Point | Frequency | Severity | Supporting Insight |
|---|---|---|---|
| No centralized Copilot reporting | High | High | Metrics existed across multiple Microsoft tools |
| Difficult ROI measurement | High | High | Business impact was difficult to quantify |
| Limited licensing visibility | High | High | Hard to determine optimal license allocation |
| Poor adoption transparency | High | Medium | Department adoption wasn't easily comparable |
| Governance reporting required multiple systems | Medium | High | Compliance monitoring lacked a unified interface |
| Employee learning disconnected from usage | Medium | Medium | No correlation between training and adoption |
14. Research & Discovery
| Issue | Insight | Decision |
|---|---|---|
| Fragmented reporting | Leadership used multiple dashboards | Build unified analytics platform |
| AI ROI difficult to justify | Executives lacked measurable KPIs | Introduce ROI dashboard |
| License optimization unclear | Usage didn't match allocations | Add Readiness & Licensing module |
| Employee engagement unknown | Training and adoption disconnected | Create Sentiment & Learning dashboard |
| Governance scattered | Security metrics difficult to interpret | Build Governance & Predictive Insights module |
| Executive reporting time-consuming | Manual report creation | Add executive overview and export functionality |
15. User Personas
| Persona | Key Traits | Goals | Frustrations | Must-Have Outcomes |
|---|---|---|---|---|
| Sarah – CIO | Strategic, data-driven | Drive enterprise AI transformation | No visibility into enterprise AI adoption | Unified executive dashboard |
| Michael – IT Admin | Operational, technical | Manage licenses and deployments | Difficult activation tracking | Centralized licensing insights |
| Emily – Finance | ROI-focused | Justify AI investments | Hard to measure financial impact | Clear ROI dashboards |
| David – HR Lead | Employee-centric | Improve AI adoption and training | No visibility into learning progress | Training analytics and sentiment monitoring |
| Jessica – Governance | Compliance-focused | Ensure responsible AI usage | Multiple compliance tools | Unified governance dashboard |
16. Core User Needs
| User Need | Evidence | Priority |
|---|---|---|
| Executive AI visibility | Leadership needs enterprise-wide reporting | High |
| License optimization | Large software investment | High |
| Productivity measurement | Need to justify Copilot ROI | High |
| Employee adoption insights | Learning impacts adoption | High |
| Governance monitoring | Enterprise AI requires compliance | High |
| Predictive forecasting | Future license planning | Medium |
17. Brand Guidelines
- • Designed following Goodyear's Enterprise Design System.
- • Desktop-first responsive experience.
- • Corporate Blue & Yellow brand palette.
- • Enterprise data visualization standards.
- • High-density dashboards optimized for executive decision-making.
- • Consistent KPI card system across all modules.
- • Accessible typography and chart hierarchy.
18. Design Process
Our systematic design process was structured to validate data configurations and ensure user adoption:
Discovery
Studied Microsoft Copilot reporting ecosystem. Identified executive decision-making requirements. Defined stakeholder-specific KPIs.
Information Architecture
Organized analytics into six logical modules (Executive Overview, Readiness & Licensing, Adoption & Usage, Impact & ROI, Sentiment & Learning, Governance & Insights).
Wireframing
Created low-fidelity dashboard layouts to establish: Navigation hierarchy, Filter placement, KPI prioritization, Chart selection, and Card consistency.
High-Fidelity Design
Developed production-ready dashboards with: Reusable KPI components, Enterprise chart library, Unified filter system, Export functionality, and Consistent interaction patterns.
Core Design Decisions
- • Persistent left-side filter panel for cross-dashboard consistency.
- • Modular KPI cards enabling quick executive scanning.
- • Mixed visualization types (line, bar, donut, scatter, tables, gauges) chosen based on the nature of each metric.
- • Executive-first information hierarchy emphasizing actionable insights before detailed analytics.
19. Design System
- • Built using Goodyear's enterprise UI standards.
- • Reusable analytics components.
- • Standardized spacing and typography.
- • Shared KPI card library.
- • Consistent chart styling.
- • Accessible enterprise dashboard patterns.
20. Appendices
Design Deliverables
- • User Flows
- • Information Architecture
- • Low-Fidelity Wireframes
- • High-Fidelity Dashboard Designs
- • Interactive Prototype
- • KPI Definitions
- • Data Visualization Guidelines
Dashboard Modules Delivered
- • Executive Overview
- • Readiness & Licensing
- • Adoption & Usage
- • Impact & ROI
- • Sentiment & Learning
- • Governance & Predictive Insights
21. Final Outcome
Enterprise AI Intelligence Platform
The Goodyear Copilot Analytics Dashboard evolved beyond a reporting interface into an Executive AI Intelligence Platform. By consolidating adoption metrics, licensing insights, productivity gains, employee sentiment, governance, and ROI into a single experience, it enabled leadership to make confident, data-driven decisions about Microsoft Copilot adoption, optimize licensing investments, and shape Goodyear's long-term enterprise AI strategy.